Dashlets
Dashlets allow users to display query results on their Dashboard in four ways:
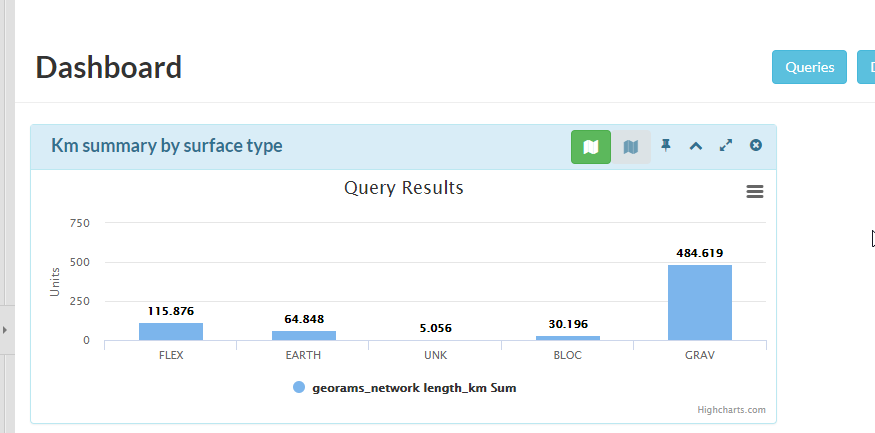
Charts
Tables
Pivot tables
Maps (future)
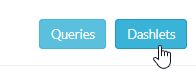
To be able to see the query on the Dashboard, a Dashlet needs to be created and pinned to the dashboard. In the Dashboard, click on Dashlets.
The Dashlet window lists the Dashlets in the same way as the queries with My Dashlets, Standard Dashlets, Shared Dashlets and All Dashlets. Click on New Dashlet.
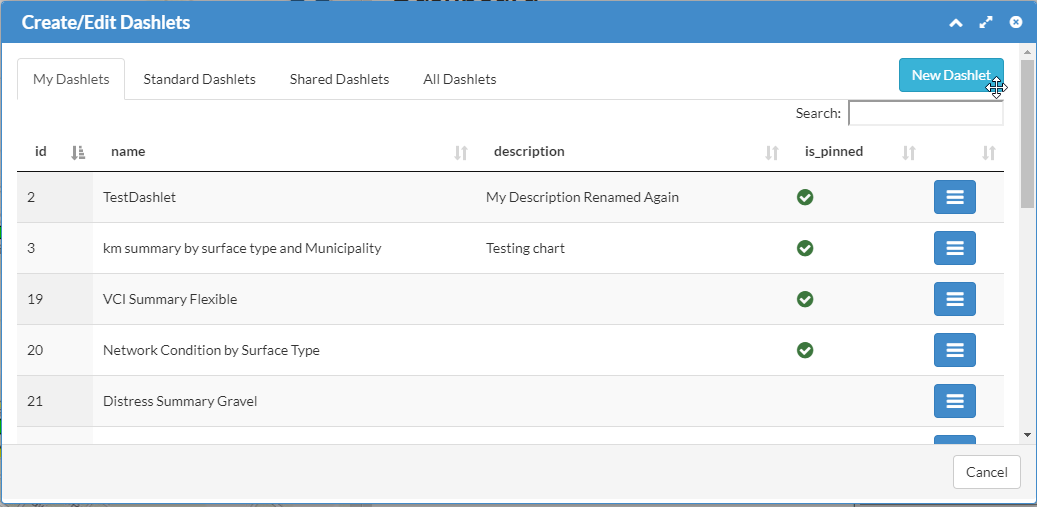
The Dashlet window lists the Dashlets in the same way as the queries. There are four tabs:
- My Dashlets – list of dashlets that you have created
- Standard Dashlets – standard dashlets that the administrator has created for all users
- Shared Dashlets – dashlets that has been shared by other users
- All Dashlets – all dashlets available to you
Creating a new Dashlet
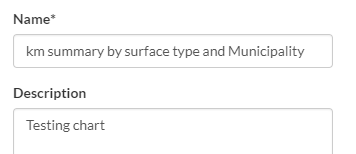
To create a new dashlet click on New Dashlet button. A dialog box will appear where you can give your new dashlet a name and add a description.
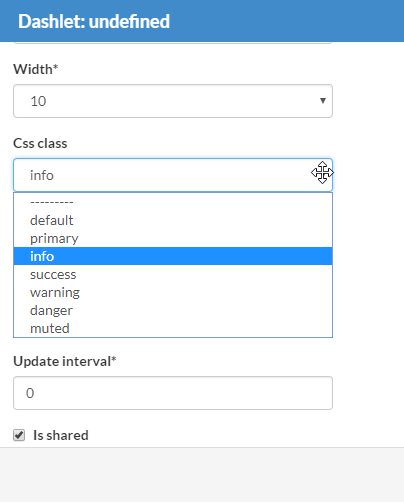
Give the new Dashlet a name and configure properties. Set the height to 300, width to 10.

Height setting – the height of the dashlet as it appears on the dashboard. Increase the height by increasing the height value.
Width setting – the width of the dashlet as it appears on the dashboard. Set the width to 12 if you want you dashlet to take up the full width of the dashboard.
Css class - this displays the dashlet in different colours:
- Default = light grey
- Primary = dark blue
- Info = light blue
- Success = light green
- Warning = light red
- Danger = darker red
- Muted = white, no colour
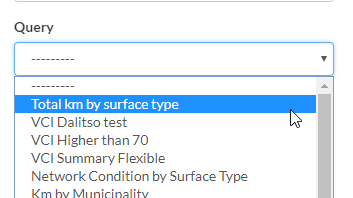
Query - select the query you would like the dashboard to use from the drop-down list. You will see all queries that has been created in the system, to which you have access. Typing the name of the query filters the list of queries for easier selection.
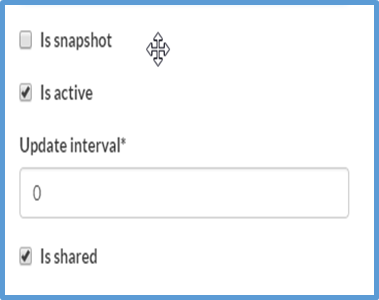
Is snapshot - this setting makes the dashlet either dynamic or static. When you select snapshot, the query will be fixed in time and not update as data is updated in the database.
Is active - this setting enables or disables the dashlet.
Update interval - set the interval (in seconds) to update the data in the dashlet if snapshot is not selected.
Is shared - set the dashlet shared if you want other users to have access to it.
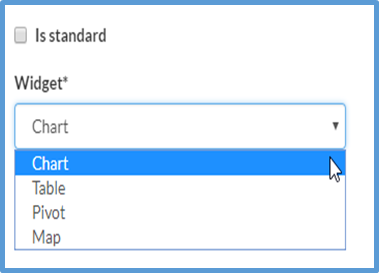
Is standard – Keep this un-ticked
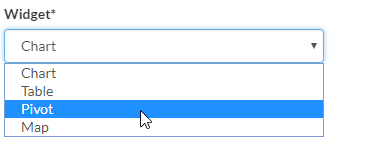
Widget – select what format you would like the dashlet to appear on the dashboard
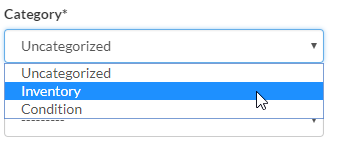
Select Category as Inventory.
The new Dashlet can be linked to a map and/or layer. Whith this option the selected layer and map will have the Dashlet linked/reference to it.
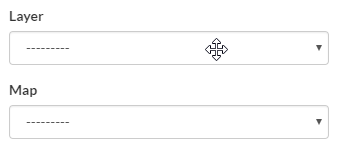
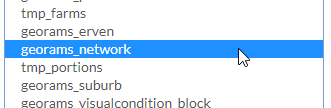
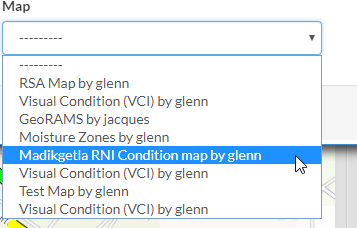
For this exercise, we will select georams_network as the Layer, and Madikgetla RNI Condition map as the Map.
Click on SAVE, when done.

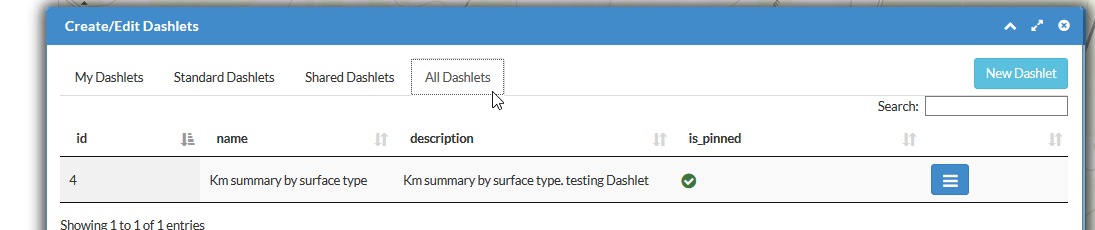
Refresh the Dashlet window to list the newly created Dashlet by closing the window, then Open the Dashlet window again. Click on My Dashlets. The new Dashlet is listed as id 4.
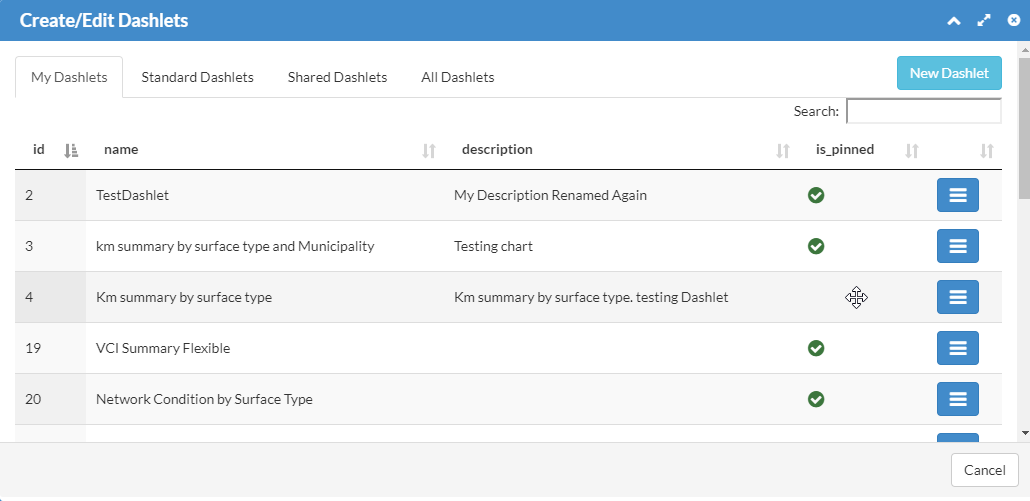
You will see that it does not have a is pinned mark.

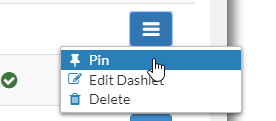
To Pin this Dashlet to the dashboard, click on the blue button on the right-hand side, and select Pin.
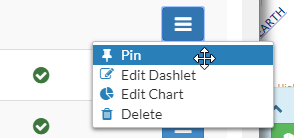
This is also the place where you can Unpin, Edit Dashlet, Edit Chart or Delete it. If this Dashlet is set to Standard when it was created, only the user that created it will have these options. Close the Dashlet window and reload the browser to see the updated Dashboard.
Create a Pivot
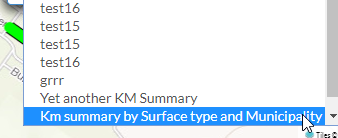
Click on Dashlets, Create Dashlet and select a query to use as a Pivot table. For the purpose of this exercise we will use “Km summary by Surface type and Municipality” as the query.
Select Pivot as the Widget option
Close the Dashlet window and open it again to reload the newly created Dashlet. Click on Pin to add it to the Dashboard.
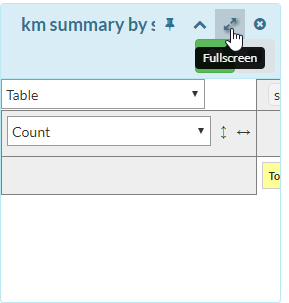
Reload the Browser to load the newly created Pivot Dashlet. Click on FullScreen to see the columns.
Click and drag the columns around to display the results.

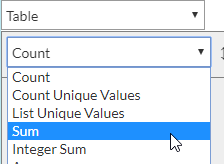
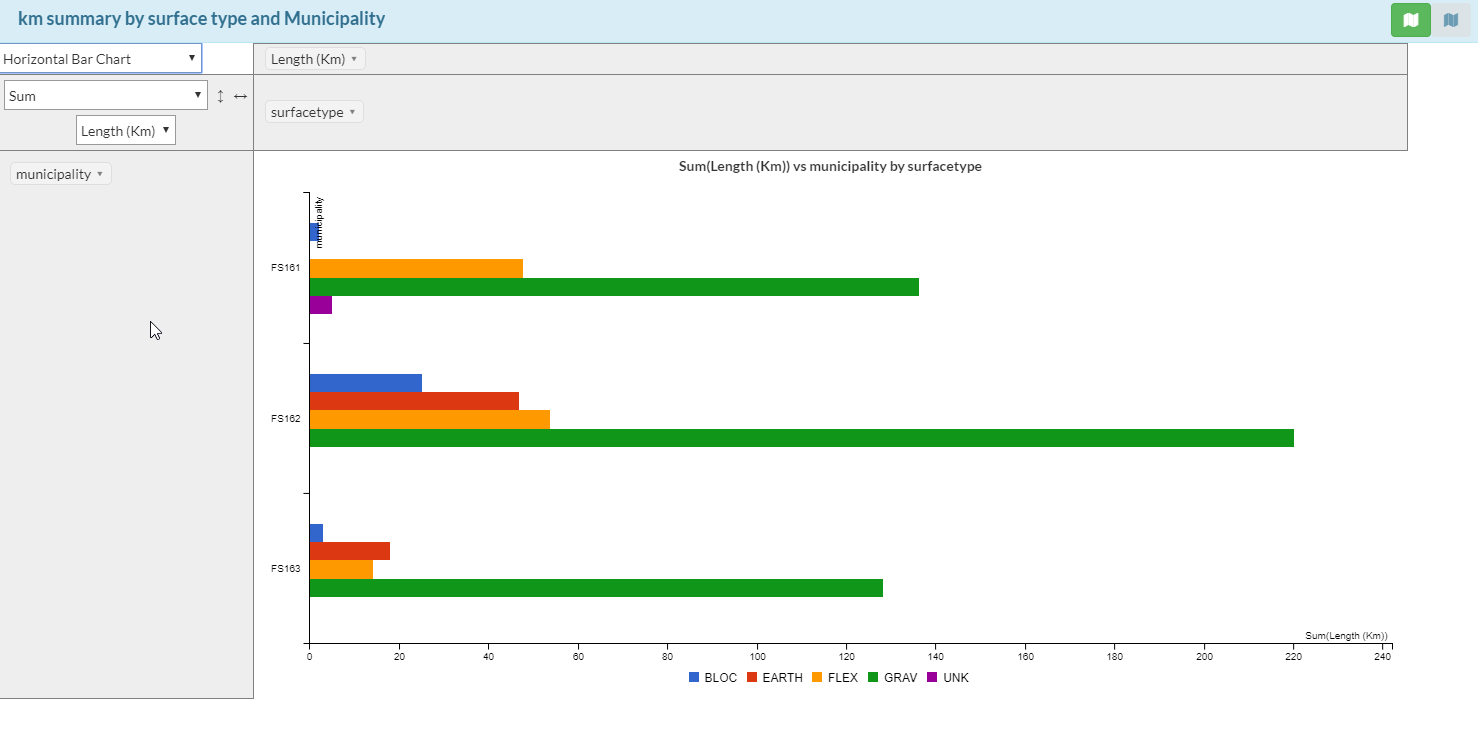
We need to see the total sum of the length in km. Select Sum in the dropdown list. Click below Sum, the column to sum, in this case Length(Km)
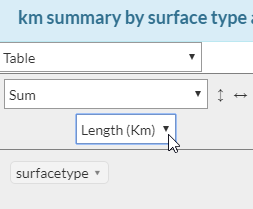
Drag the column name municipality to the left and surfacetype to the bottom. This will give the result for total km of road per surface type and Municipality.
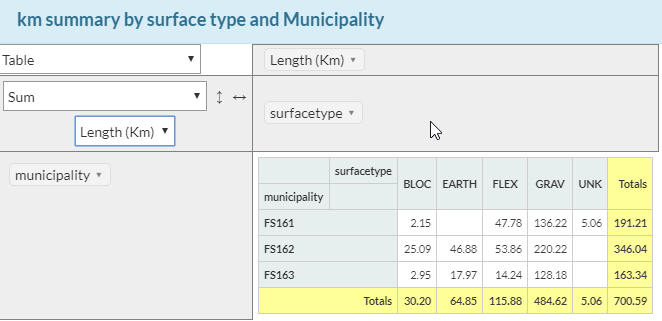
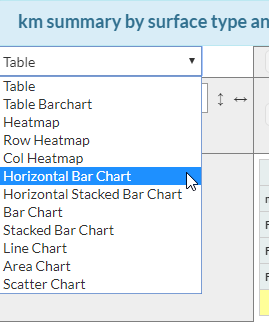
This can now be viewed in many different ways. Click on the Table drop down to select one of the options.
Click on the minimize button to close the full screen view or Click on the Pin button to pin it back to the Dashboard
Dashlet navigation bar
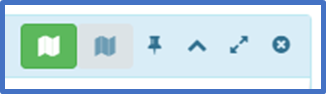

Pin or unpin the dashlet from the dashboards. When unpinned the dashlet window can be moved anywhere on the screen

Minimises the dashlet so that just the dashboard title bas is visible. This reduces clutter on the dashboard

Resizes the dashlet into a full screen window

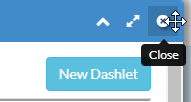
Closes the dashlet window. The dashlet will reload when the screen is refreshed.

Shows the geometries of the features listed in the dashlet on the dashboard map
Dashlets that are linked to Layers and/or Maps
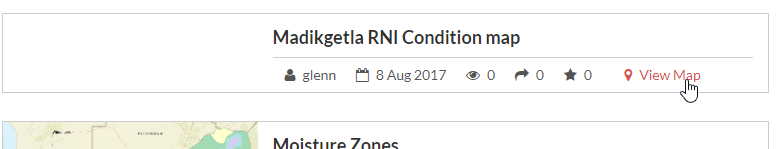
Click on Maps to open the map that you want to work with
Select View Map of the Map that we linked to the Dashlet. “Madikgetla RNI Condition map”.
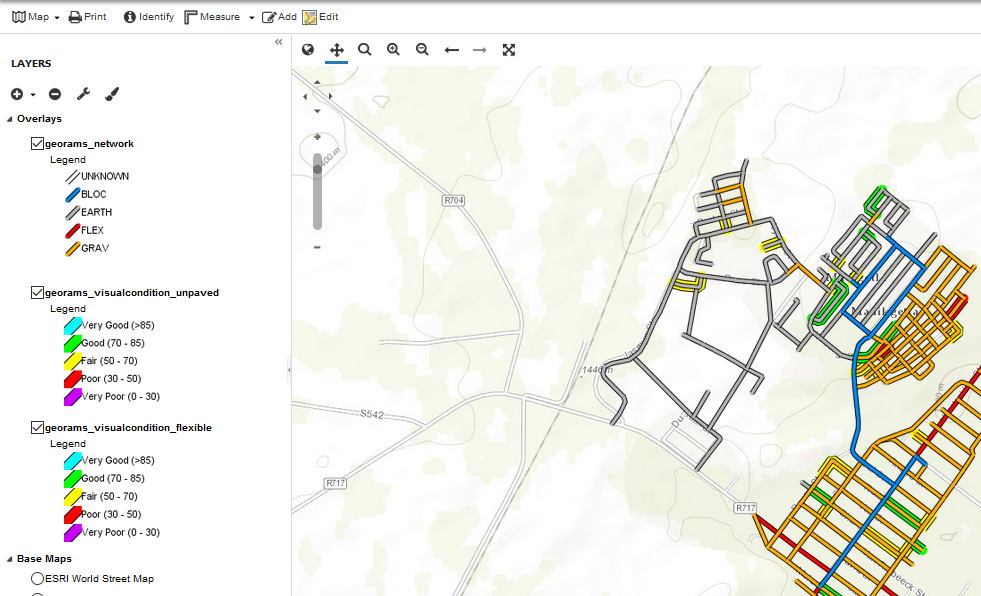
In the Map window, the left hand side indicates the layers that are loaded in the map, and the right hand side displays the map.
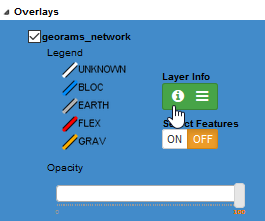
Click on the georams_network layer. The layer will highlight. Click on Layer Info to see the Dashlets that are linked to the layer in the map.
In this layer information window click on Queries and Dashlets to see a list of queries and Dashlets that are linked to this layer.
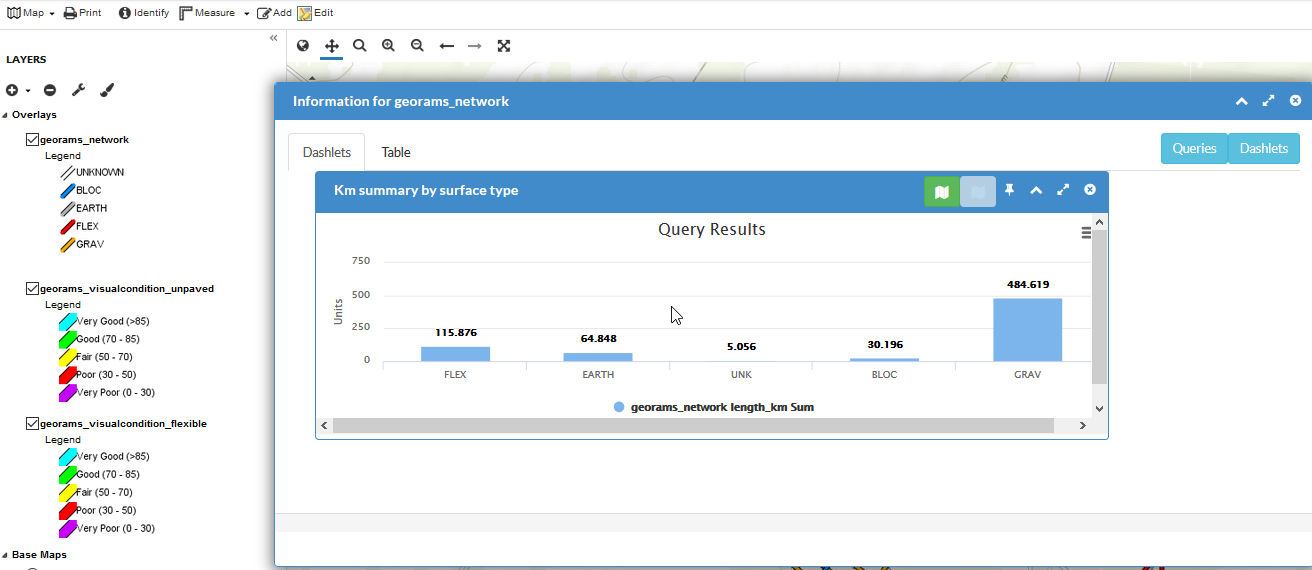
In this case only one Dashlet is linked. New Dashlets can also be created in this view/window.