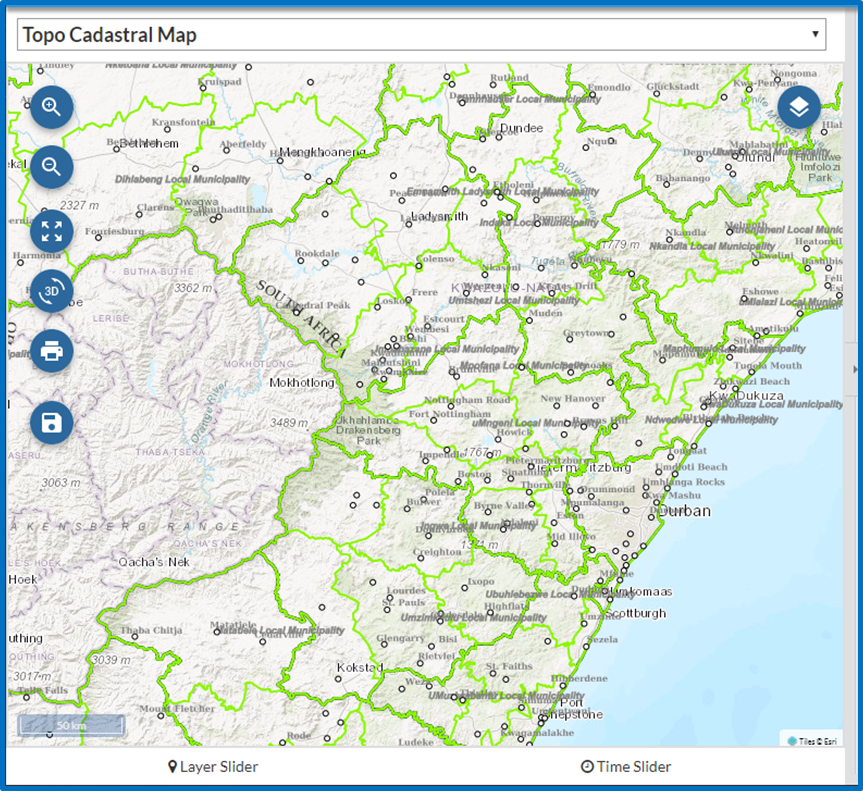
Dashboard map
The map on the left-hand side of the screen, indicates the last map that was created by the user or admin person. This map can be used to view and identify information, add layers, and change styles.
Map tools
Use this tool to zoom in to the map. Press the tool more than once to zoom in more.
Use this too to zoom out of the map. Press the tool to zoom out more.
Use this tool to zoom back to the extent of the layer.
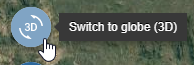
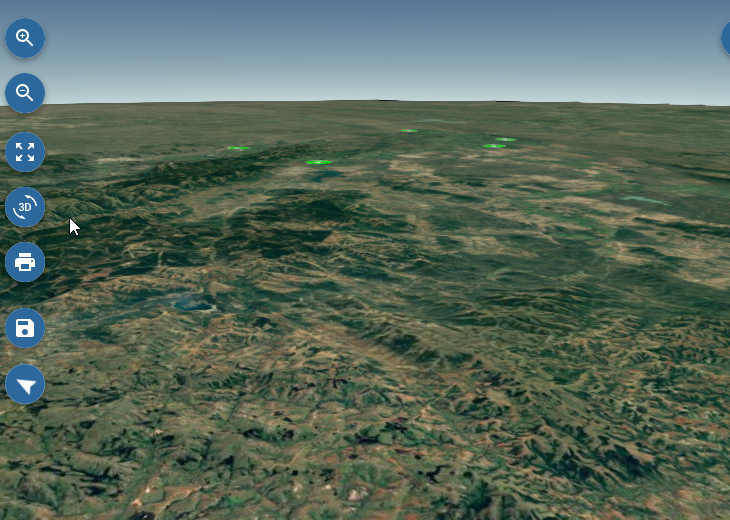
This tool switches to 3D view. Use your shift key and mouse scroll button to navigate in this view.
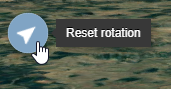
Click on the North arrow to turn the map back to its original position. North facing up.
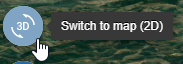
Switch the map back to 2D view with this tool.

Print your map as a Pdf file.

The user can add other layers to the map and save it.

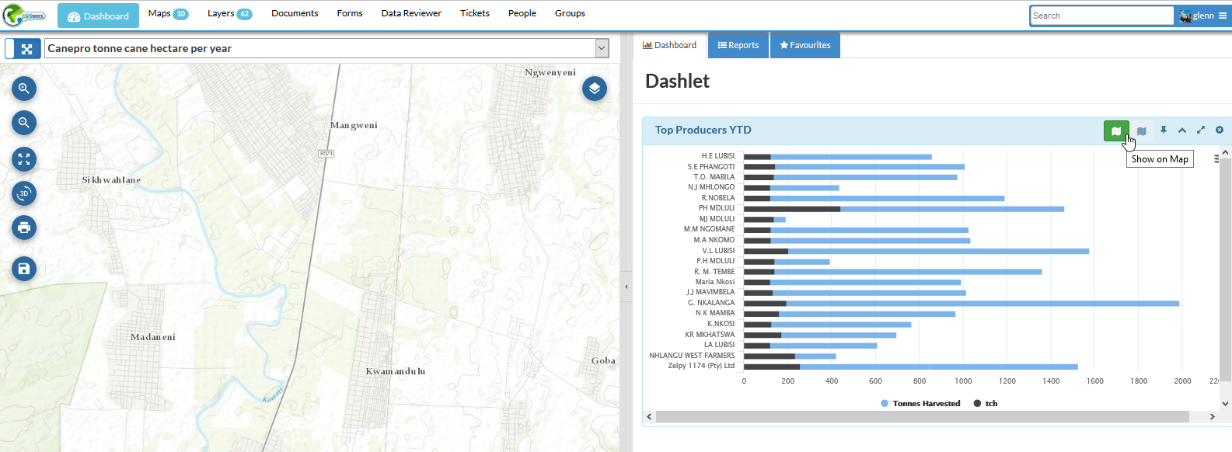
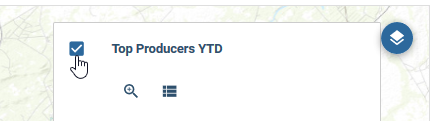
Add or manage layers.
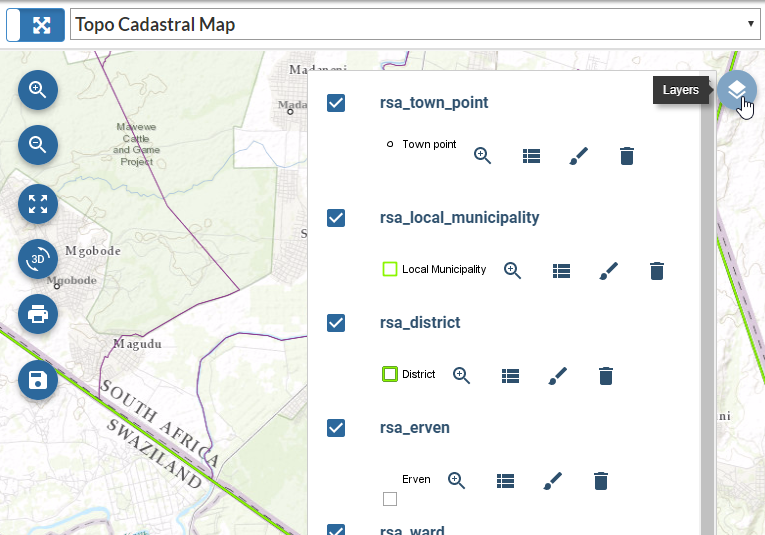
Click on the Layers tool to select the layers to be on or off, zoom to the layer, delete the layer from your map. In this map the user can also view the attributes in the database table.
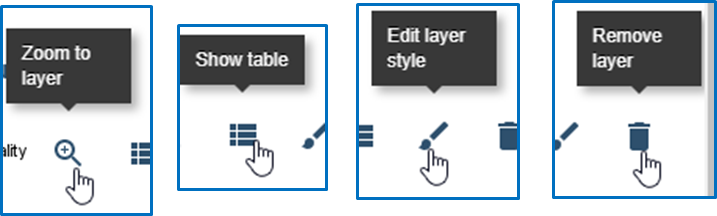
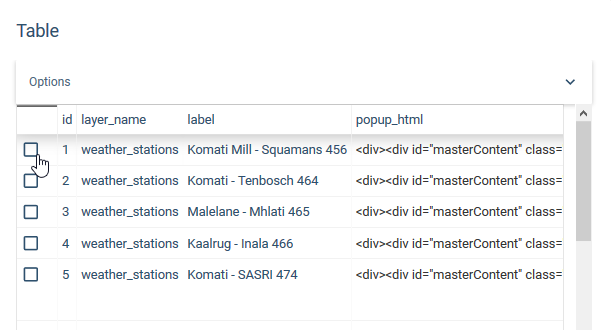
Click on Show table to look at the attribute data/records in the database
Select the records that you want to see on the map. Click on Options, then on Selected only.
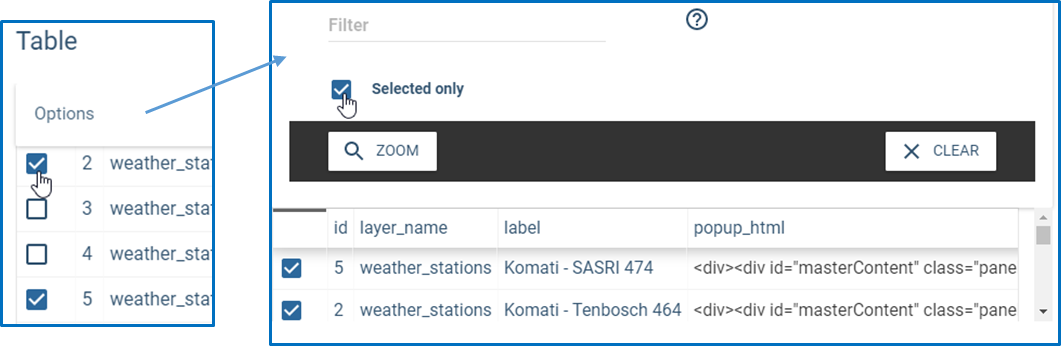
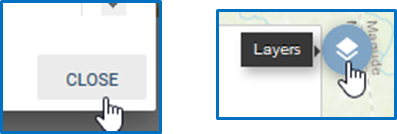
Click on Zoom to display the selected records on the map. Click on Close to close the Table Option view. Click on the Layer tool in the map to close the layer list. Now you will see the selected records in the map.

This map is also interactive with the Dashlets from queries that was saved with geometries
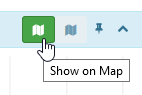
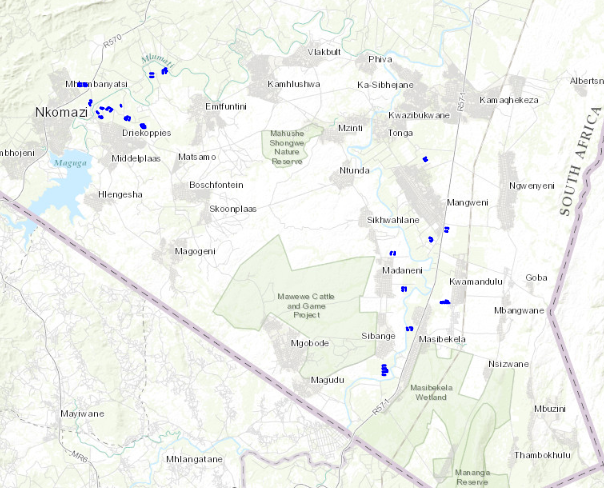
Click on Show on Map to display the records from the query/Dashlet on the map
Click on the Layer tool to show the layers. Here the selection can be turned off and on
Click on the View Table tool to go through the attribute list.