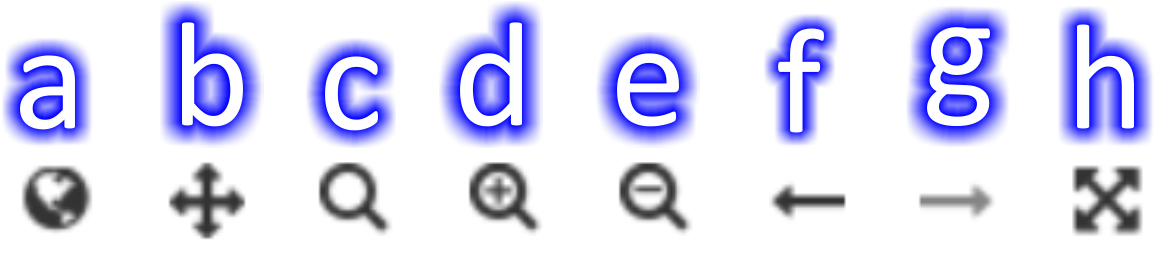
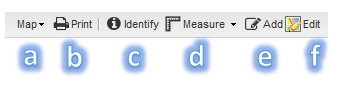
Interactive map

To access the full-screen interactive map, click the View Map button om the map screen:

image0

image1

# ELEMENT DESCRIPTION SCREENSHOT
1 Main Toolbar
  • Toolbar for navigating on map
  • Set styles
  • Identify features
  • Measure area and length
image2
# Element Description Screenshot
a

Map

image3

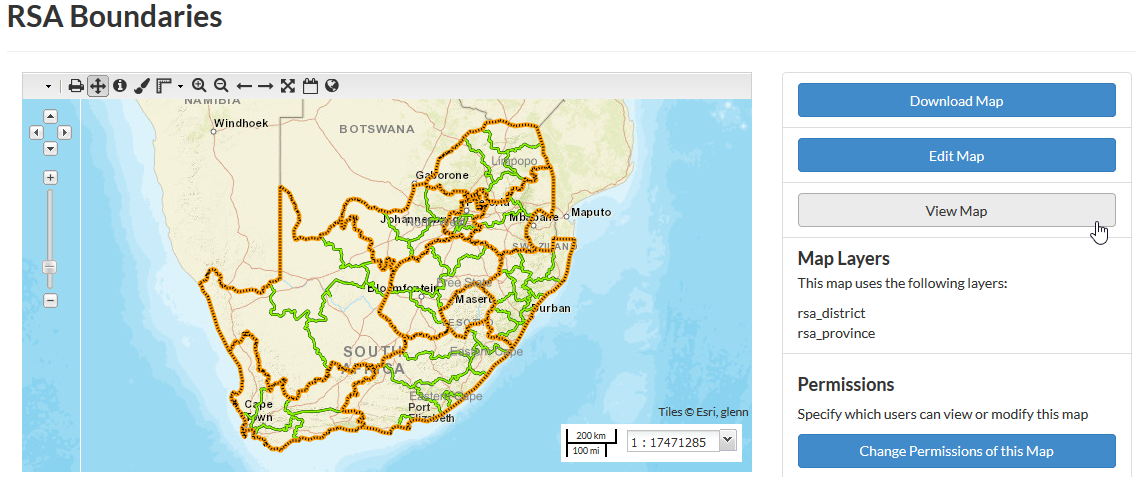
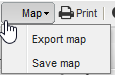
  • The Map button gives you the option to either export or save the map.
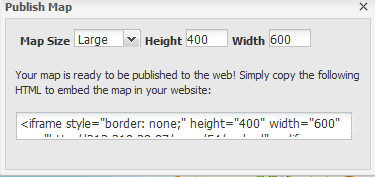
  • Export map is used to create an embedded version of the map for use on other web pages. “Save as copy” and “Save” does the same thing. The Publish Map dialog opens with the HTML code to embed in another web page. You have the option to change the map size.
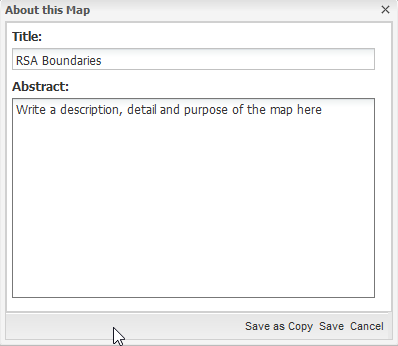
  • Save Map will save any changes you have made to the map back to the system. “Save as copy” in this case makes a new version of the map and preserves the original, while “Save” will overwrite the original with the new version.

image4

image5

image6

b

Print

image7

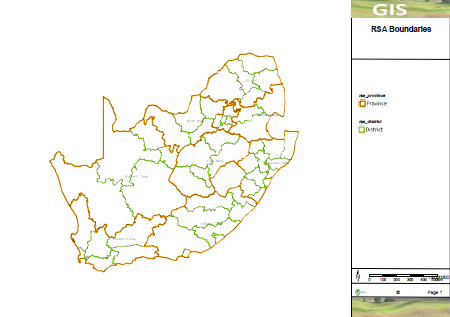
  • Print the map to PDF
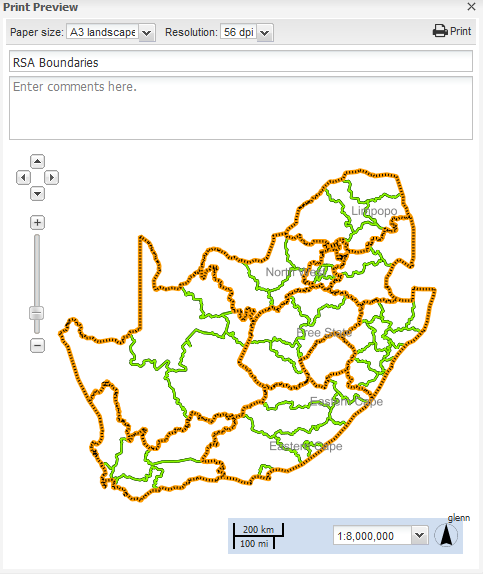
  • The Print Map dialog allows you to choose a paper size and print resolution.
  • You can edit the title and description of the map and choose to include the legend or not.
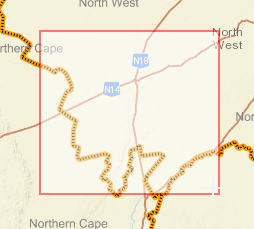
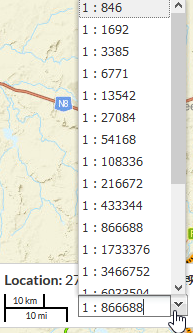
  • You can change the scale of the map in the Scale widget at the bottom.
  • When you are satisfied with the map setup, click the Print button. image8
  • Then choose a location to save the resulting PDF file to your computer.

image9

image10

c

Identify

image11

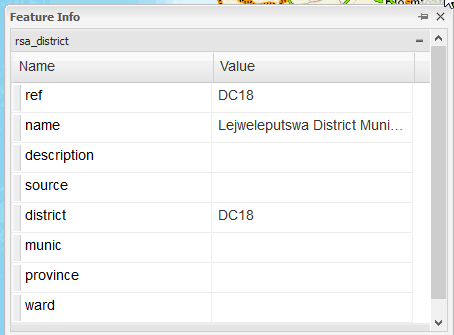
  • Click the Identify button to view information about selected features.
  • image12Click on a feature on the map and the Feature Info dialog will open.
  • Click on the pin to unpin the information window. This will enable you to move the window around on the screen.
  • image13When you click on more than one feature, all elements will be listed in the identify window. Click on the to minimise the items in the list.
  • Click on the X to close the window

image14

image15

d

Measure

image16

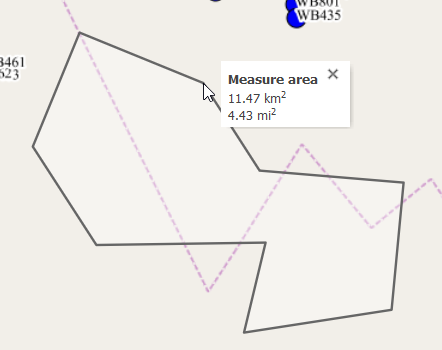
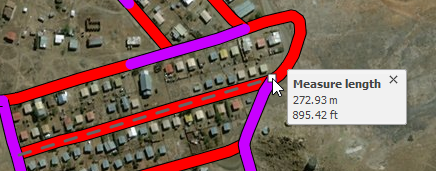
  • The measure button lets you measure either length or area on the map.
  • Choose the desired tool from the dropdown.
  • To measure length, click on the start point of the line you want to image17measure. Move the mouse to the end point. Click on each turn or corner. The length is shown in km and miles.
  • End measuring by double-clicking.
  • The measuring line will stay there until you click the Measure button again.
  • To measure area, click around the area to build op a polygon. The area is displayed in km2 and mi2.
  • Click the Measure button again to remove the polygon.

image18

image19

f

Edit

image20

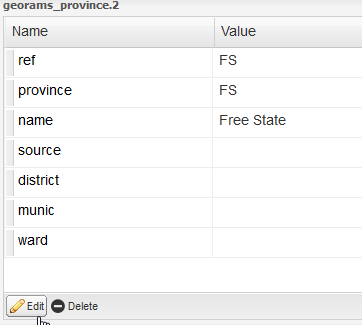
  • The Edit button allows you to modify existing features on the map.
  • Click on the feature you want to modify.
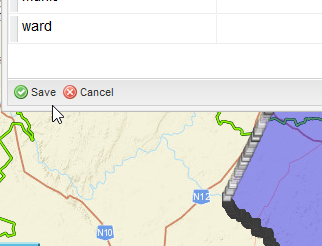
  • A dialog opens with the feature’s information. Click Save when done or Cancel to exit without saving.
  • To create a feature, click on the Add tool. The mouse pointer on the map will change to show a small blue circle image21.
  • Move the mouse pointer to the desired location and click there.
  • A dialog opens where you can type in the data associated with the feature. Click Save when done or Cancel to exit without saving.
  • feature by clicking and dragging it to a new location.
  • Click Save when done.
  • Alternatively, you can click Deleteimage22 to delete the feature.

image23

image24

2

Layers Toolbar

image25

# Element Description Screenshot
a

Add Layers

image26

  • The Add Layers button allows you to add layers from different data sources to your map.
  • Double-click a layer to add it to the map.
  • Click the “Layers” breadcrumb to navigate back to the main Layers area.

image27

  • The new layer will now be shown under Overlays.
  • You can un-tick it if you want to hide the features, or right-click to access the layer menu where you can remove it.
  • This also gives you access to Layer Properties, Layer Styles and Layer Info, discussed below.

image28

image29

image30

image31

b

Remove Layer

image32

  • Removes the currently selected layer from the map.
 
c

Layer Properties

image33

  • Opens the Layer Properties dialog.
  • On the About tab you can see general information about the layer.
  • On the Display tab you can edit certain options to fine-tune how the layer should be displayed.
  • Drag the Opacity slider to adjust the layer opacity.
  • Untick the Cache option to force the system to load the layer fresh.
  • The two format dropdowns can be used to specify the type of data format to be used.
  • You can filter your layer by adding conditions similarly to the Query conditions discussed before.
  • You can also limit the layer display to a range or scales, outside of which the layer will not be shown.
  • Available Styles tab shows a dropdown of styles for this layer. You can create new styles using the Layer Styles button discussed next.

image34

image35

image36

image37

d

Layer Styles

image38

  • The Layer Styles button opens the Styles dialog. Here you can choose an existing style, edit it, duplicate it, remove it or add a new style.
  • You can also create rules that allows conditional formatting of your style depending on attribute values. A style can have many rules.
  • Add a style: This allows you to create a new style. Choose a title and description and click Save at the bottom of the screen.
  • Edit a style: This allows you to change the title and description of the selected style. Click Save at the bottom when done.
  • Duplicate lets you make a copy of the selected style, giving it a new name.
  • When you add a new rule, it is added as “untitled 1”, but then you have to Edit it to give it a name and set all the options.
  • On the Basic tab, set the name, choose a symbol, set the symbol size and colours as desired.
  • On the Labels tab you can set which attribute to use as label, as well as the formatting of the label.
  • On the Advanced tab you can set the conditions for your rule to apply. This can be used to format different subsets of data in different ways on the map.
  • Click Save at the bottom of the screen when done.

image39

image40

image41

image42

# Element Description Screenshot
3 Overlays
  • Overlays refer to the layers you have added to the map. Right-click an overlay for specific options, or click to select it and use the Layers toolbar options discussed previously.
 
4 Base Maps
  • Base maps refer to the background imagery of the map. You can choose not to have a background by selecting “No background” in this list.
  • Right-click these items for options to remove and zoom to extent.
image43
5 Map Toolbar   image44
6 Interactive Map
  • If the pan tool is active, clicking and dragging on the canvas will pan the map
  • Double clicking on the canvas will zoom in
  • Mouse wheel in/out will zoom in/out
image45
# Element Description Screenshot
a

Switch to 3D viewer

image46

  • This will be implemented as a WebGL viewer.
 
b

Pan Map

image47

  • Click this button and then click and drag the map to pan.
image48
c

Zoom by dragging box

image49

  • Click this button to zoom by drawing a box on the map.
image50
d

Zoom in

image51

  • Click to zoom into the map incrementally.
 
e

Zoom out

image52

  • Click to zoom out of the map incrementally.
 
f

Zoom to previous extent

image53

  • This zooms back to whatever the previous view was.
 
g

Zoom to next extent

image54

  • This zooms to the next extent, if you have already zoomed back to the previous extent.
 
h

Zoom to max extent

image55

  • This zooms out to fit the entire data set.
 
# ELEMENT DESCRIPTION SCREENSHOT
7 Map Area
  • The map area has three controls that allow you to open and close sections on the screen. The one to the left closes the Layers area. The one on the right closes the Bookmarks.
image56
8 Map Scale
  • Use the map Scale widget to change the scale.

image57

image58